Now in Beta — Limited Early Access

Turn RAP Data Into Actionable Insights

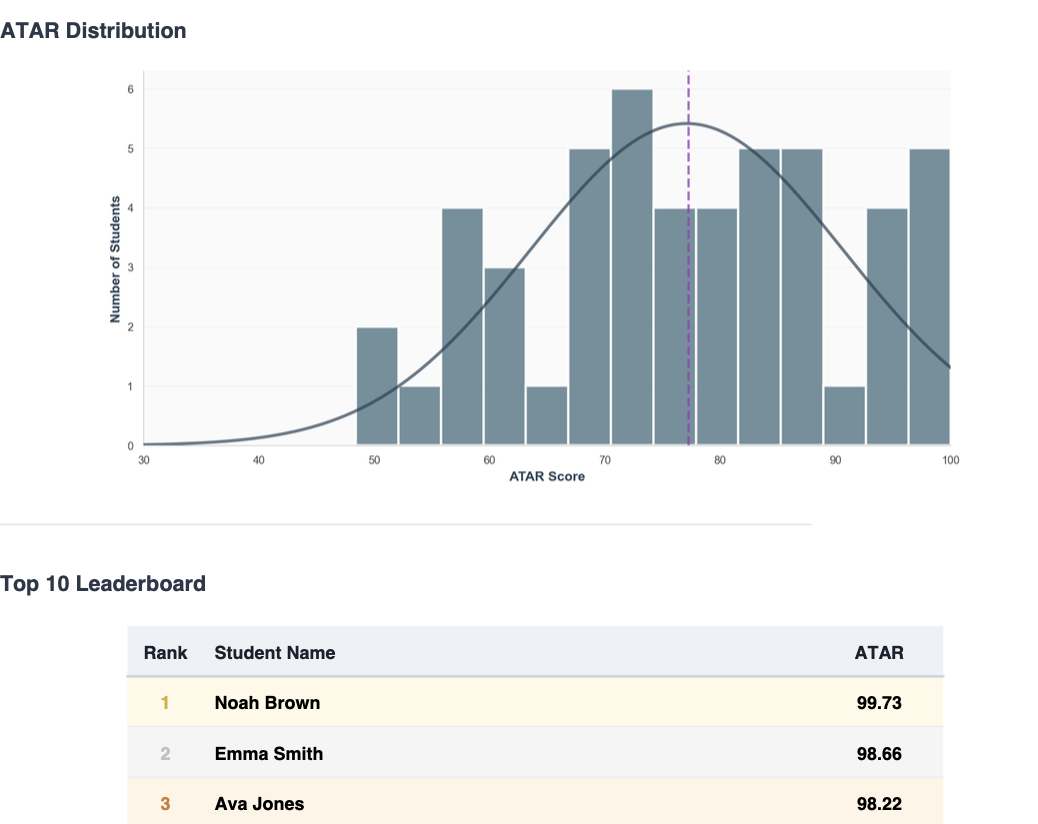
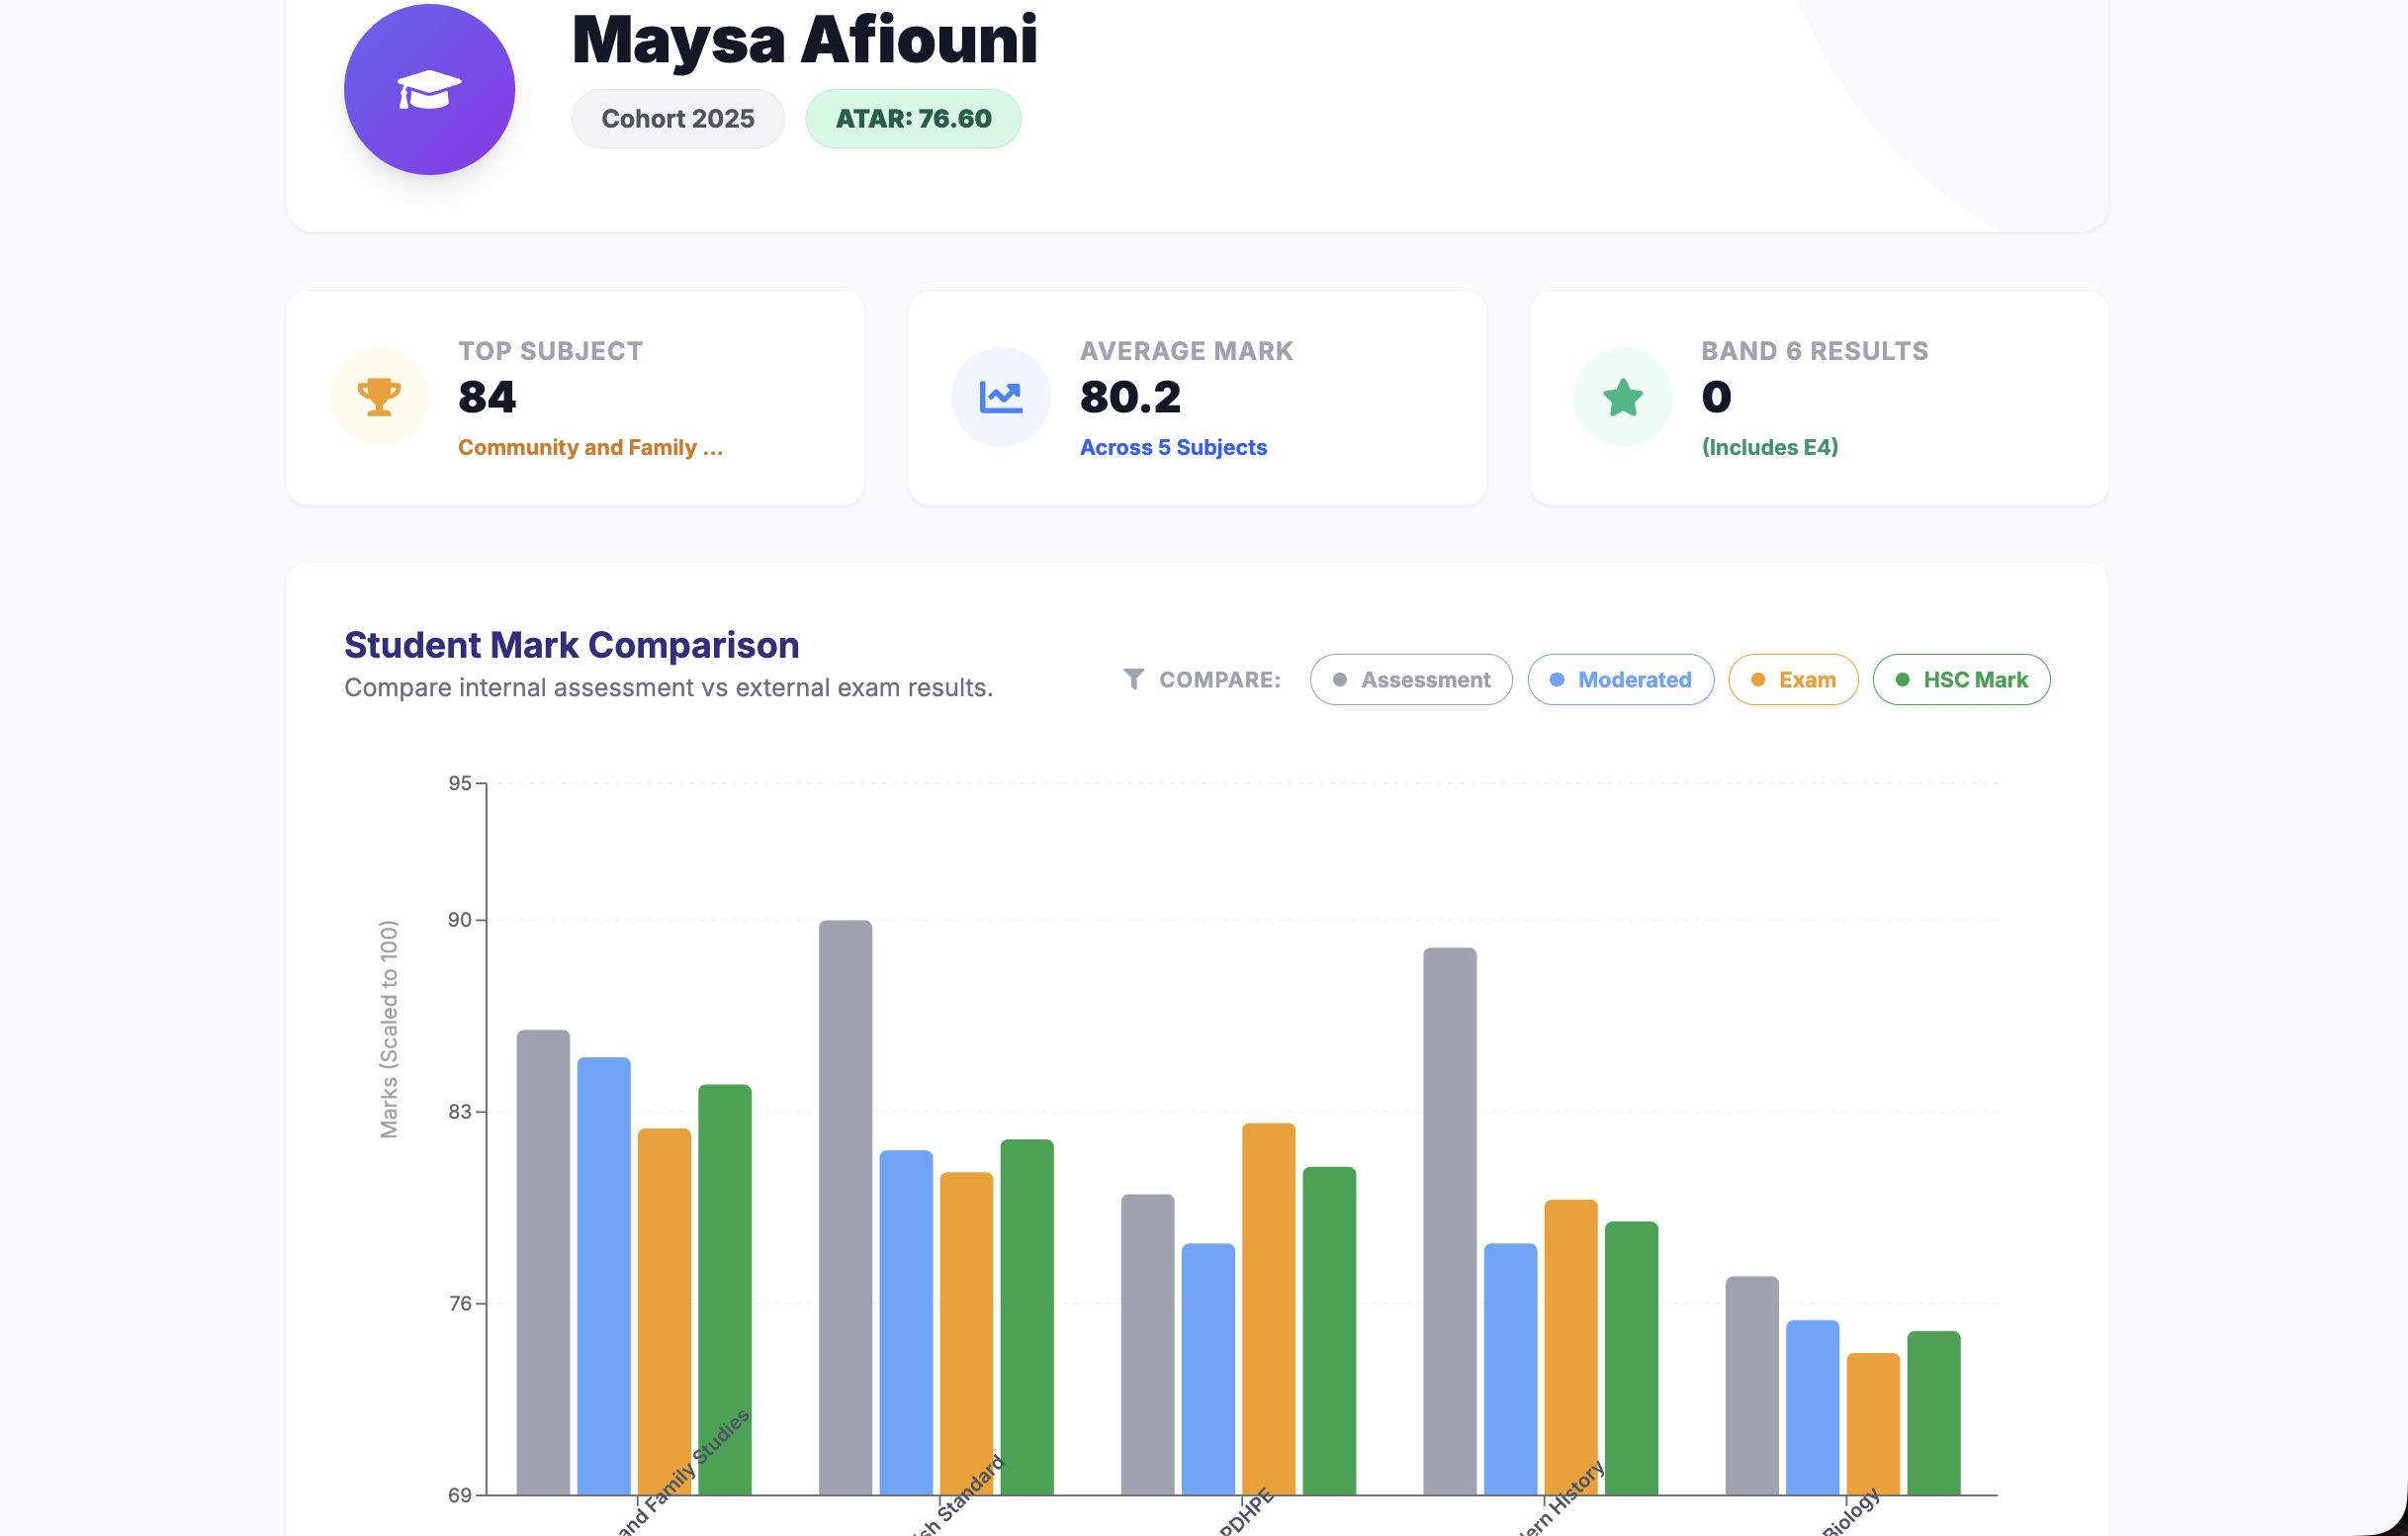
Comprehensive HSC analysis that goes beyond government data. Understand your cohort, identify trends, and make data-driven decisions to improve student outcomes.

Edflow executive dashboard showing coordinator view with ATAR, Band 6s and school leaders

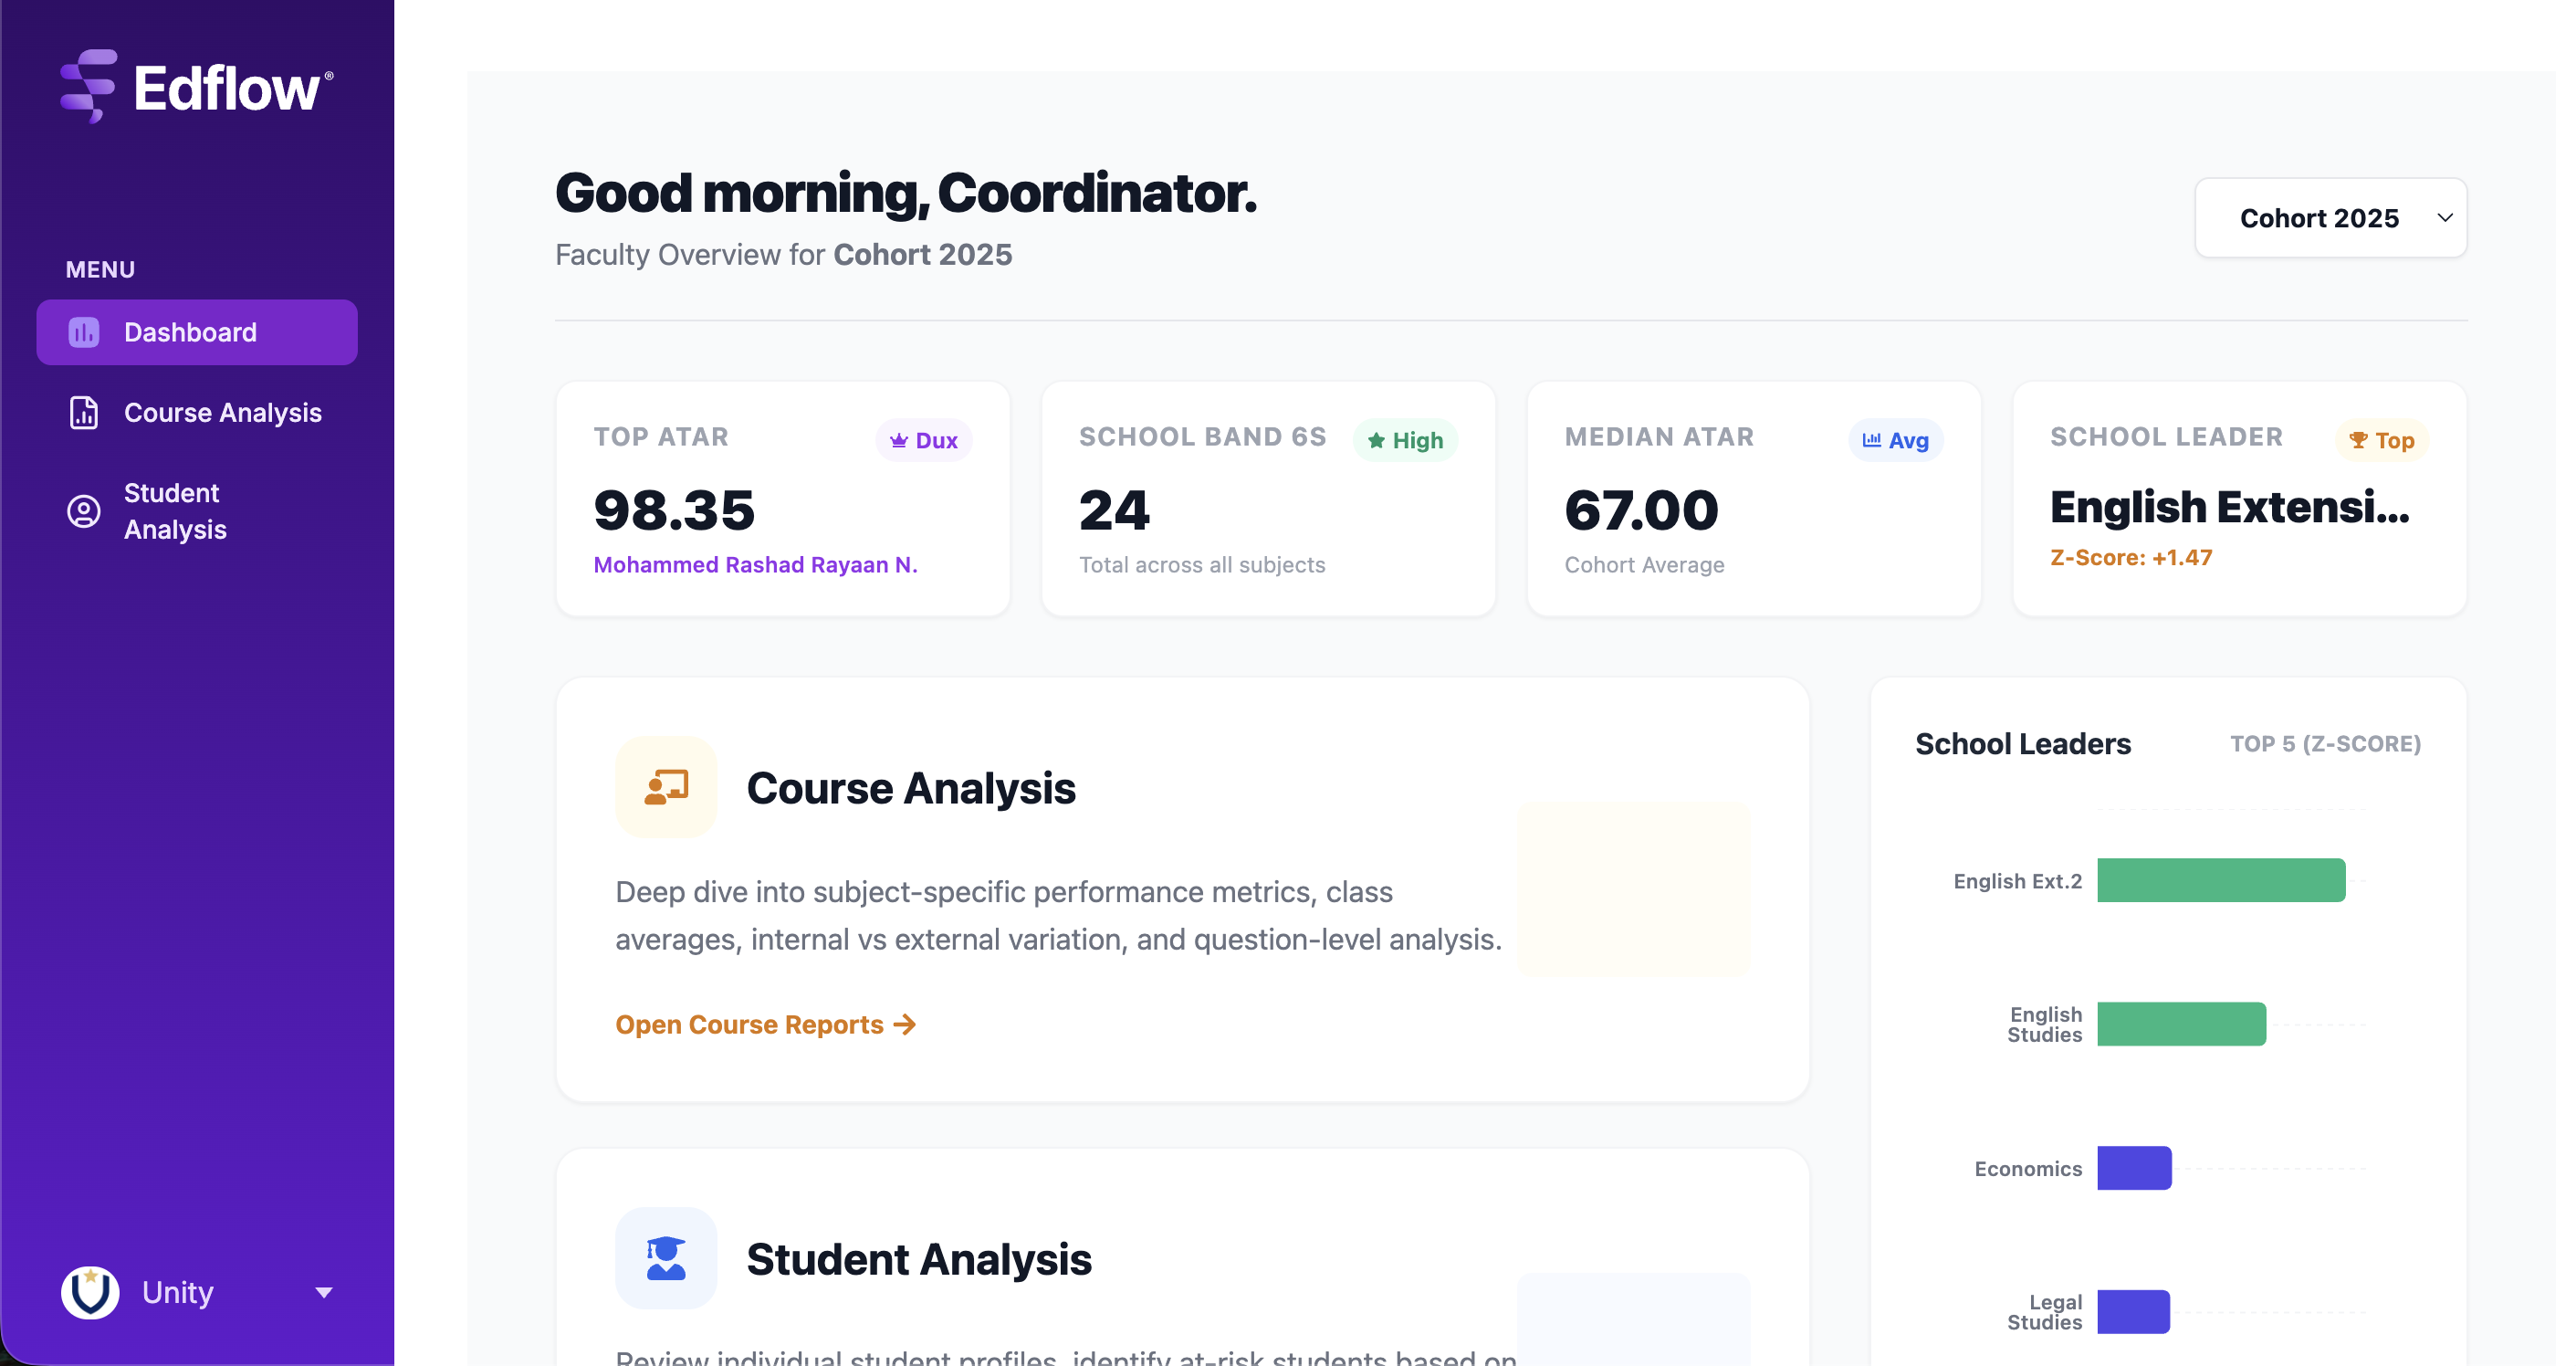
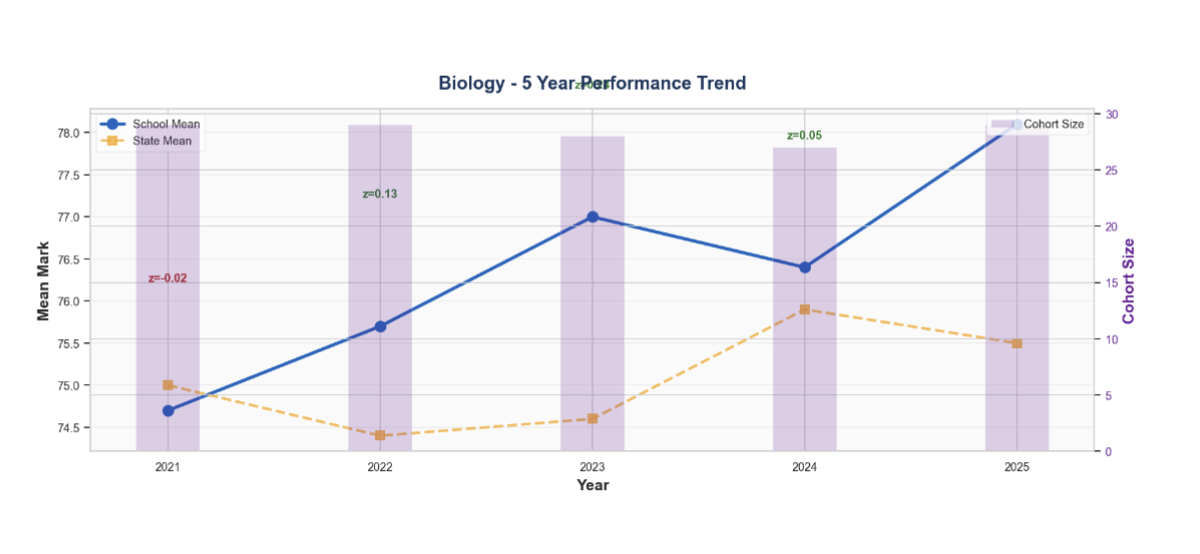
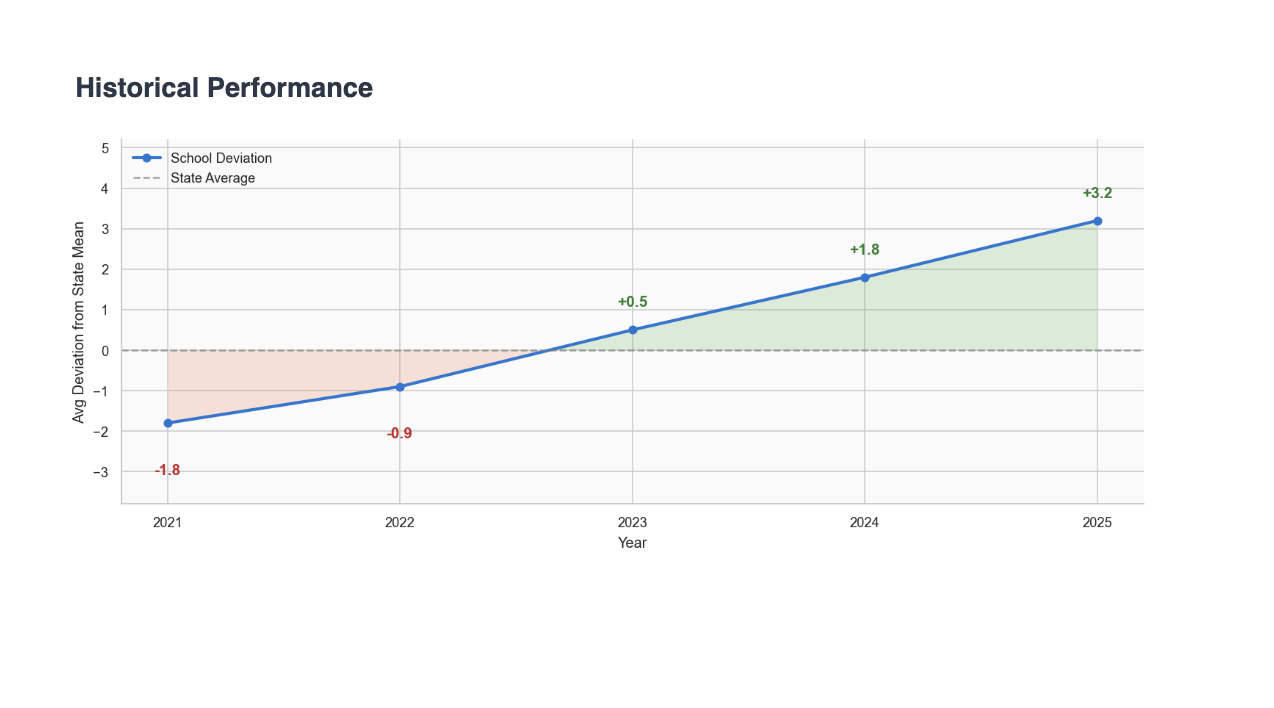
Track your school's performance trends over time

RAP Data Alone Isn't Enough

Schools receive RAP data every year, but turning that data into meaningful improvements remains a challenge

Numbers, Not Insights

Government RAP reports give you raw data, but not actionable intelligence

Manual Analysis Takes Hours

Spending precious time manually comparing year-over-year performance

Difficult to Identify Needs

Hard to pinpoint which subjects or students need immediate intervention

No Achievement Tracking

Can't easily track Band 6/E4 achievement trends across cohorts

Leadership Needs More

School leaders need actionable intelligence, not just spreadsheets

Traditional RAP Reports
Biology — 5 Year Performance Data
School_Code, Subject, Year, School_Mean, State_Mean, Z_Score, Cohort
12345, Biology, 2021, 74.8, 75.0, -0.02, 28
12345, Biology, 2022, 75.7, 74.4, +0.13, 26
12345, Biology, 2023, 77.0, 74.5, +0.11, 22
12345, Biology, 2024, 76.4, 76.0, +0.05, 17
12345, Biology, 2025, 78.0, 75.5, +0.09, 11
... 47 more subjects

Raw data that requires hours of manual analysis

Edflow Analysis
Edflow subject analysis showing Biology 5-year performance trend with school vs state mean

Actionable insights at your fingertips

Expanded Analysis. Actionable Insights.

Transform your RAP data into comprehensive reports that drive meaningful improvements

Executive dashboard showing school ATAR analysis and cohort metrics

Executive Dashboard

Complete school-wide insights for leadership

  • School-wide ATAR analysis
  • Historical trends 2021-2025
  • Cohort size and metrics
  • Band 6/E4 achievement rates
Biology subject performance showing 5-year trend analysis

Subject Deep Dives

Comprehensive subject-level performance analysis

  • Question-by-question analysis
  • 5-year performance trends
  • Mark distribution insights
  • Identify struggling topics
Student ATAR distribution and top performers leaderboard

Student Reports

Individual and cohort student performance tracking

  • ATAR distributions and trends
  • Top 10 leaderboards
  • Subject performance comparisons
  • At-risk student identification
HSC exam question performance analysis by cohort

HSC Exam Analysis

Detailed exam performance and question analysis

  • Comprehensive cohort analysis
  • Question difficulty ratings
  • Performance by marking criteria
  • Year-level comparisons

From Data to Decisions

Empower every stakeholder with the insights they need to drive student success

For Principals & Leadership

  • Track school improvement over time
  • Compare performance against state averages
  • Present clear data to school board
  • Identify departments needing support
  • Monitor ROI on educational initiatives

For Heads of Department

  • Understand subject-specific trends
  • See which topics students struggle with
  • Plan targeted intervention programs
  • Track historical improvements
  • Benchmark against similar schools

For Teachers & Coordinators

  • Identify at-risk students early
  • Understand cohort strengths and weaknesses
  • Use data to inform teaching strategies
  • Evidence for parent-teacher meetings
  • Track effectiveness of support programs

Every stakeholder gets the insights they need, in the format they need them.

See How It Works

Available Both Online & As PDF

Access your insights anytime via the web platform, or download professional PDF reports for board meetings and staff briefings

Executive dashboard with ATAR, Band 6s and school leaders overview

Executive Summary

Historical performance tracking school improvement trends over 5 years

Historical Performance

ATAR distribution analysis with cohort insights

ATAR Distribution

Subject performance trend analysis comparing school vs state mean

Subject Analysis

Student report showing individual performance and rankings

Student Report

Question-level performance metrics and difficulty analysis

Question Analysis

Everything You Need to Drive Improvement

Automated RAP data ingestion
5+ years of historical analysis
Beautiful, shareable reports
School vs state comparisons
Band 6/E4 tracking
Regular updates with new data
Limited beta spots available

Ready to Turn Your RAP Data Into Insights?

Book a 15-minute session and we'll show you exactly what your school's data looks like inside Edflow — no setup required.

15 minutes, no fluff
No commitment required
NSW schools only

Book a 15-Min Demo

Video call with the Edflow team

What's covered

  • Live report walkthrough

    We pull up insights based on your school's actual RAP data

  • Sample reports from real schools

    See what principals and HODs are using week to week

  • Q&A with our team

    Ask anything about the data, methodology, or how it works

  • Implementation timeline

    We walk you through how quickly you can be up and running

No commitment. Cancel anytime.